
Building the Perfect Customer Journey
What’s the difference between profitable businesses that consistently throw money in the bank month after month, and businesses that fail? A huge factor is building a high converting marketing funnel around the customer journey.
But the truth is, there are a lot of factors to think about.
You need a good product. A good niche. Good marketing hacks.
But one thing that most entrepreneurs miss is building airtight sales and marketing funnels.
A sales funnel will throw money in your bank consistently, month after month.
It’ll add more predictability to your sales. It’ll give you a nice buffer, so you can test out newer (riskier) marketing tactics without worrying about losing revenue. A sales funnel, or a marketing funnel, is a process that businesses can use to turn website visitors or prospects into paying customers. It’s a way of creating the right type of content (or experience) at each stage of the customer journey, and moving customers to a point of purchase.
Before we can understand what a high converting sales funnel looks like, we need to first understand what customer journey mapping is.
We need to understand how to gradually push prospects along the journey, and take the right actions at every step.
1.1 Psychology of the Customer Journey
In order to understand the customer journey, it’s important to understand why people take the actions they take. A big part of this is understanding consumer psychology.
In 2009, Stanford psychologist BJ Fogg developed the Fogg Behavior Model, a chart that explains the three key factors that determine whether or not someone takes an action.

According to BJ Fogg, “three elements must converge at the same moment for a behavior to occur: Motivation, Ability, and a Prompt.”
As an entrepreneur, it’s important to keep your ‘prompts’ (or calls to action) in the top right area of the graph. You want CTAs that are easy to complete, and you want to give your audience high enough motivation to take those actions.
Let’s break each of these three factors down:
Motivation
You can motivate potential customers in different ways.
One way is through urgency or fear of missing out. Take The 5th for example, an apparel company that releases limited edition watches on the fifth of every month.

You can also do it by developing a brand or a story that customers feel attached to.
For example, Will Bowen created the “No Complaints Bracelet” – a simple purple bracelet that helps people kick their habit of complaining. The bracelet got traction after Bowen shared in a book how going 21 days without complaining changed his life
His story helped get the bracelet featured on Oprah, Dr. Oz, and more.
According to Fogg, motivators always boil down to some version of hope/fear, seeking pleasure/avoiding pain, or chasing social acceptance/avoiding social rejection.
Ability
Ability refers to whether or not the customer is actually able to take the action you want them to take.
For example, is your product priced appropriately? Do your customers have the money to buy it? Is your checkout process simple, or does it take extra effort on the customer’s part to navigate through the process? How many ‘brain cycles’ does it take for them to figure out how to take the action?
Much of this involves proper user experience design, which we’ll get into later in this e-book.
Prompts
The prompt is also known as a trigger, a call to action, or a request for a sale.
Triggers should be shown appropriately depending on how familiar a customer is with your product or brand.
For example, driving someone directly to a checkout page for a high-priced product when they have never heard of your brand before may not convert so well.
Instead, a more effective prompt for new visitor might be something like the following – a smaller commitment where you present something of value (i.e. a discount code) instead of asking for a purchase:

We’ll talk more about the above factors later in this e-book when discussing sales funnels and conversion optimization.
But it’s important to remember that there are many different stages in the customer’s journey to buying your product – and having the right motivation, ability, and trigger is important to help move customers down the journey as effectively as possible.
1.2 Stages of the Customer Journey
When customers find your products and buy from you online, they usually go through these four stages:
Stage 1: Awareness
At the awareness stage, customers have just discovered your brand. This typically happens through social media channels you might be active on, your website, or advertising channels.
At the awareness stage, customers don’t know much about your company or who you are.
Stage 2: Consideration
At the consideration stage, customers are checking out your product or service and seeing what you have to offer. They might be browsing your product catalog, or adding items to their cart.
One way to push customers down from the awareness stage to the consideration stage is by offering a coupon code, or special promotion to people visiting your site.
For example, notice how GlassesUSA gives visitors a 50% off discount code for their first frame, if they opt-in with their email.

Asking people to opt-in with their email allows you to both push them down the customer journey faster by presenting them with a discount code directly in their inbox. And it also gives you their contact information so you can remarket to them later.
Stage 3: Preference
At the preference stage, customers do research on your company and similar products.
If you’re selling a commodity product that differentiates on brand (like a watch, a t-shirt, shoes, etc) then the ‘preference’ stage will consist of checking out product reviews, or social proof from others who have ordered from you. Customers would want to know whether product quality lives up to the pictures they see online.
This is probably the most important stage of the customer journey.
According to the numbers, 90% of consumers read less than 10 reviews before forming an opinion about a business, And 84% of shoppers trust online reviews as much as personal recommendations from their friends.
A study from Reevoo also showed that 50 or more reviews per product can result in a 4.6% conversion rate boost. For a business that gets a lot of traffic, this could be a difference of tens of thousands (or even hundreds of thousands) of dollars.
If you’re selling a utility product (i.e. a product that solves a unique problem), then customers would also be looking at other companies that sell similar products and comparing differences.
As we’ll mention later, it’s important to have some social proof, testimonials, or case studies for this stage in the customer journey.
Stage 4: Purchase
If everything is done right up to this point, customers will be ready to make a purchase.
At this stage, the ‘ability’ factor (from BJ Fogg’s framework) matters most. If you have a smooth checkout and payment system (along with a cart abandonment funnel to recapture customers), you’ll make it easier for customers to make a payment decision.
We’ll talk more about cart abandonment sequences later in this e-book.
1.3 How to Create Your Customer Journey Map
So far, we’ve talked about consumer psychology and the psychological triggers that get people to take action.
We’ve talked about the stages of the customer journey from awareness to purchase.
And in this section, we’ll talk about how this applies to you. We’ll talk about how to map the customer journey for your own site, or what the customer journey map would look like (if you’re just getting started).
Let’s dig in.
Narrow in on your buyer persona(s)
Before you can create the perfect content and experience for your visitors’ customer journeys, you need to first understand who you’re creating them for. You need to narrow in on your buyer personas.
If you already have an online business, you can use Google Analytics (as we’ll show you) to find out who’s landing on your site. If you’re just getting started, you can use this section to help identify who your ideal customers would be.
Customer personas are typically broken down into a few categories: geographic, demographic, psychographic, and behavioral.

Geographic
Where are your ideal customers based? Are they in the US, UK, or worldwide? Keep in mind that there may be shipping considerations to account for depending on where your customers are located.
Demographic
What kind of person are you looking to sell to? Are they younger or older? Are they men, women, or both?
Other (seemingly unrelated) demographic traits can also be a great indicator of the personality type of your audience – things like whether they own homes or rent homes, whether they own cars or take the bus, etc. These characteristics can help you adjust your content, brand, and the details of your customer journey.
Psychographic
In addition to the demographic and geographic details, you’ll also want to dial in on the views and values of your audience. What’s their ‘identity’?
For example, do they see themselves as ‘gym rats’? Vegans? Fashionable? Forward-thinking? Religious?
Beliefs play a big role in the types of brands and personalities people respond to.
Behavioral
Finally, what kind of behavioral attributes would your target audience have? What careers would they have? Are they executives, or 20-somethings starting out? Do they frequently travel for business, for fun, or neither?
If you’re just getting started with your online business, you can write down some initial answers to these questions to for clearer direction. If you already have a business and a website set up, you can analyze your existing traffic in Google Analytics to answer these questions with your existing data.
We’ll cover analytics more in depth later in this e-book, but quick way to use Google Analytics to uncover details about your visitors is by looking at your Audience Reports.
For example, you could check out the tabs under ‘Audience’ on the left hand bar as shown below:

If you click on ‘Demographics’, you’ll get a snapshot of the gender and age breakdowns of the people visiting your site:

You could answer behavioral questions about your audience by hitting the ‘Interests’ tab on the left hand bar:

You’ll get a sense for what kind of hobbies your audience has. For example, in the screenshot above, the top interest among visitors is movies and TV shows, closely followed by news.
You can use the Location tab under ‘Geo’ to see where your visitors are primarily based:

Once you know who you’re targeting, you’ll be in a much better position to create the right type of content at every step in the customer journey.
Analyze user flow to see how users navigate through your site
As you recall, at the awareness stage, customers are just finding out about your business and your products. Usually this happens through social media, paid advertising, organic traffic, or other channels you’re using to promote your business.
The first step in mapping your customer journey is getting a deep sense of where your customers are coming from and who they are. It’s about understanding the analytics around the customer journey.
If you’re just getting started in launching your business, now’s a great time to set up Google Analytics – so that when you do get customers, you’ll know exactly who they are and where they’re coming from. You’ll have a good sense for what the awareness stage of your customer journey looks like.
We’ll talk more about the technical details of analytics setup later in this e-book.
The best way to leverage Google Analytics to envision your customer journey map is by looking at the Google Analytics Behavior Flow report.
If you login to Google Analytics, you can access the Behavior reports in the left hand bar:

In the ‘Behavior Flow’ tab, you’ll find the path that visitors take when checking out your site. You’ll see their ‘journey’ from how they find your site to the first page they view to the last page they visit before leaving.

This will show you data on where your site’s visitors are coming from. You’ll see data on what pages they visit, how long they stay on those pages, and where the ‘dropoff’ is.
Here are the different elements of the Google Analytics Behavior Flow report:
Connections
The grey bands that connect the boxes at the different stages are called ‘connections’. These bands signal where visitors are moving. For example, in the screenshot above, you can see that a bulk of organic traffic visitors land on the homepage of the site while a smaller chunk lands on one of the 48 other pages.
Connections help you uncover the path that the majority of visitors travel down from finding your site to buying your product.
Drop-offs
Drop-offs are points where visitors leave your site. In the above screenshot, drop-off points are shown through the red bands. The thicker the band, the more drop-off there is on the page.
These bands can help you uncover pages on your site that prevent visitors from advancing down the customer journey. Based on the data, you could optimize the UX on your site to push customers down the process of ‘awareness’, ‘consideration’, ‘preference’, and ‘purchase’ as fast as possible.
For example, you might add exit-intent popups with discount codes to capture visitors that on the verge of bouncing.

Loopbacks
Loopbacks refer to connections between a page and a previous page that a visitor has previously seen. For example, in the screenshot above, there are a number of people going from the home page to the careers page and back to the home page.
Loopbacks signal that visitors haven’t found what they’re looking for, and aren’t progressing down the customer journey. While this might be fine when viewing a careers page, it might be a sign of some UX issues if this were happening on a product page, for example.
In addition to Google Analytics, another strategy you can use to analyze how users interact with your site is recording visitor sessions.
For e-commerce marketing specifically, you can install an app like Hindsight.
Hindsight records visitor sessions through screen recordings. You can see where visitors are viewing (and clicking) through heatmaps:

A more advanced option would be a product like User Testing. User Testing allows you to request a certain number of people who fit your target demographic requirements to go through your site and complete specific tasks.
For example, you could ask people to go through your checkout process, or give feedback on your product selection.
1.4 Customer Journey Map Templates
Once you know who you’re targeting, and once you know the path they travel down when they hit your site (or the path you want them to travel down), then you can begin to create a customer journey map.
To create a customer journey map, first take your research data and organize it into an easy-to-read table.
Here’s an example:

You can replace ‘X’ with whatever product you’re trying to sell.
Based on your buyer persona research, and based on the data from how users interact with your site, what’s their psychology at each step of the purchase process? What are they thinking? What are they doing? What are they feeling?
And based on that information, what opportunities do you have to move them down the journey faster (or more effectively)?
Here’s a similar template you can use to document the action steps you can take to apply your research to crafting a more compelling customer journey.

The above customer journey map template also includes a column for ‘Post Experience’ – the experience a customer has after purchasing your product.
In the later sections, we’ll talk more in depth about the specific types of content work best at each stage of the customer journey, and how to use this as a foundation for building sales funnels that convert customers consistently.
Chapter 1 Takeaways
- According to consumer psychology, an action occurs when motivation, ability, and a prompt converge at the same moment. The primary motivators are hope/fear, pleasure/pain, and social acceptance/social rejection. Ability refers to whether or not the customer is actually able to take the action you want them to take. The prompt is also be known as a trigger, a call to action, or a request for a sale.
- There are four different stages of the customer journey: awareness, consideration, preference, and purchase.
- When narrowing in on your buyer persona, outline their geographic, demographic, psychographic, and behavioral characteristics.
- If you already have a site up and running, Google Analytics is a great place to analyze customer journey analytics. You can find data about your existing audience under the ‘Audience’ tab.
- To analyze how visitors are interacting with your site, check out the Google Analytics Behavioral Flow Report. You can also use visitor recording tools like Hindsight or UserTesting.com.
Once you understand what customer journey mapping is, and once you understand your buyer persona, you can start thinking about how to optimize every stage of the customer journey.
Building a High-Converting Marketing Funnel
When you’re first starting your online business, it’s all about short-term hacks like cold calling, cold emailing, and affiliate marketing. While these short-term tactics can get you those first few sales, your long-term success will depend on you creating an effective marketing funnel.
According to studies, 73% of leads are not ready to be sold to. That means that no matter where they come from, no matter how you source them, the vast majority of leads will not be ready to buy from right away.
That’s where lead nurturing comes into play.
Lead nurturing is the process of guiding leads along the path to buying from you. And if you’re relying on random tactics to grow your business, you’d be leaving hundreds, thousands, or even tens of thousands of dollars on the table.
Without a structured marketing funnel to take people from first learning about you to buying from you, there’s no way to have a long-term system to grow your business.
When a business has a structured marketing funnel, conversion rates will increase greatly and, hopefully, boost your profits.
In this chapter, we’ll give you a quick recap of the buyer’s journey. Then, we’ll talk about how to build a powerful marketing funnel that gets (and keeps) customers for the long term.
A marketing funnel is the process your customers take from beginning to end – from first hearing about your product to the time they actually pull the trigger and make the purchase.
Before you can understand the stages of a marketing funnel, we need to first recap the anatomy of the buyer’s journey, which we covered in Chapter 1.
Here are the stages of the buyer’s journey.
Stage 1: Awareness
At the awareness stage, customers would have just discovered your brand. This could happen on challenges like your website, social media, advertising or something else. At this stage, customers don’t know much about your company or who you are.
Stage 2: Consideration
At the consideration stage, customers would be learning more about your product or service to see what you have to offer. They’d be doing things like looking at product reviews, adding items to their cart, etc.
Stage 3: Preference
Not all marketing funnels take this step into account – many just skip straight from ‘consideration’ to ‘purchase’.
While this might seem like an unnecessary detail, customers do research on your company’s products (and similar products) at the preference stage. You could also think of this stage as part of the ‘consideration’ stage.
At this stage, product reviews matter the most.
Because customers are evaluating your products at this stage, it’s the most important part of the customer journey. Customers typically don’t read that many reviews before forming a lasting opinion about your product – and according to the numbers, 84% of shoppers trust online reviews just as much as personal recommendations.
At the preference/consideration stage, it’s important to have things like case studies, testimonials, and product reviews.
Stage 4: Purchase
The final stage is the purchase stage, where customers are ready to finally make a transaction.
After this stage comes the most important part for businesses: retention.
We’ll go more in depth on the purchase stage of the marketing funnel and what comes afterwards in the coming chapters.
2.1 How to Map Your Marketing Funnel
A marketing funnel helps guide people from the awareness stage to the purchase and the upsell stage by nurturing them with the right content.
There are three main stages of the marketing funnel: 1) Top of Funnel, 2) Middle of Funnel, and 3) Bottom of Funnel.
Here’s a marketing funnel graphic:

To build a profitable funnel, you need to create the right type of content for each stage of the marketing funnel. However, 65% of marketers are still challenged when it comes to understanding which types of content are effective and the types of content aren’t.
The ‘top of funnel’ (ToFu) helps build awareness around your product, or the problem you’re looking to solve.
If you’re running an online business, your top-of-funnel might consist of advertising on Instagram or Facebook. If you’re running an online business selling digital products, it might be blog posts that give free information around the problem you’re solving.
At the top of funnel, customers are just finding out about your business. While some hot leads might be ready to buy right away, the vast majority won’t be ready yet. At this stage, most customers are just beginning to gather information they need to understand more about their needs.
The next marketing funnel stage is the ‘middle-of-funnel’, or MoFu.
At this stage, customers are beginning to evaluate products at a deeper level. They start learning more about the problem they’re looking to solve, or the products they’re looking to get.
At the middle-of-funnel stage, customers would be looking for information that helps them answer their questions about choosing a solution. Good MoFu content might be things like advertorials, video tutorials, podcasts, or webinars.
The final stage is called the ‘bottom of funnel’, or BoFu.
We’ll touch more on BoFu in the coming chapters. Basically, BoFu content is about showing customers why your solution is the right one for them. They’ve gotten information about their problem, they’ve learned how to choose a solution, and they’re now evaluating products against each other to see which one is the best fit.
At this stage, things like free consultations, webinars, or discount codes could get customers across the finish line.
To see these steps in more practical detail, we’ll refer to what Neil Patel calls the ‘conversion funnel’ in the coming sections. This process will improve your marketing funnel conversion rates.

Source: 2Stations
The conversion funnel follows the same ToFu → MoFu → BoFu stages. In the next section, we’ll talk more about how to create content for each of those stages.
2.2 How to Craft Top-of-Funnel (ToFu) Content
ToFu content is usually built with the intention of helping customers become aware of the problem that your product solves.
If a person doesn’t know they have a problem, there’s no way they’re going to make the purchase. If they’re not aware of their problem, they have no context – and they’re not going to understand why they even need your product in the first place.
If you’re selling sales software, your customers’ problems might involve scaling their sales team. If you’re selling shoes, your customers’ might be looking for ways to improve their style. These problems can range from something that’s easily-solved with tactics and templates to problems that are more intangible.
Let’s say your car has a flat tire. Your problem is a tangible, real challenge that has a relatively quick solution: you need a new tire. And if you don’t know how to replace it yourself, you’d need someone to help you. But if you’re looking for a new computer for example, you might need more help in solving your problem. Should you look for a MacBook or a PC? If you go for a MacBook, what kind of MacBook should you get?
The more advanced the problem is, the more difficult it would be to find a solution. For example, you might be looking for a lawyer for legal help in an area you’re totally unfamiliar with.
For different types of businesses, the needs of customers at the ‘top of funnel’ stage would be different.
If you’re running a web development agency, your clients would first realize that they have a problem around your area of expertise (i.e. a slow website, or bad design).
Understanding will help you craft the right type of content to bring awareness to your business or product.
Top of funnel content is usually geared towards attracting a broad audience – an audience that might be searching for high-level topics associated with your brand.
At this stage, high-level educational content is best.
For example, check out this article by MindBodyGreen, a site in the wellness niche that sells courses on things like mindfulness and nutrition:

They wrote a ToFu blog post titled ‘5 Weird Questions That Could Help You Uncover Your True Purpose’ to attract people who might want to explore more about finding themselves, spirituality, and so on.
You can use Google’s search suggestions to uncover questions your target audience might have in the awareness stage. These are the questions you could help answer with your top of funnel content.
For example, let’s say you’re selling a fitness product to help people gain muscle. At the top of the funnel, your audience will be searching for content to learn more about strength training or weight training. To uncover specific questions, you can type in something like the following into Google search, and see what search suggestions come up below:

In the case of strength training, you could write a blog post on the benefits of strength training, why you should strength train, benefits of strengthening different parts of your body (i.e. your core, etc) to bring people into your world by giving them the information they need.
You could also use a tool like AnswerThePublic.com, and get dozens of key phrases related to a topic (i.e. strength training) that you can use to craft content.

Your top-of-funnel content could take the form of articles, interactive quizzes, or even videos.
For example, here are a couple of videos fitness entrepreneurs have posted on YouTube as part of their top-of-funnel content:

While the main purpose of top-of-funnel content is to educate customers about their problems, another goal is to get their contact information so that you can contact them again.
This might involve them subscribing to your YouTube channel, or sign up to your email list.
One way MindBodyGreen gets people on their email list is by offering a free webinar link at the bottom of some of their blog posts. Readers can click through, enter their name and email, and register for the event.

This way, the company can continue to send subscribers content as they move down the funnel.
2.3 How to Craft Middle-of-Funnel (MoFu) Content
At the middle of the funnel, customers will be at a point where they’ll be evaluating different products and offerings.
At this point, you may have already gotten their email address or contact information as well.
In the middle of the funnel (or ‘consideration’ stage), buyers would be looking for content that shows how you can directly help them. It’s the time when customers evaluate the best way to actually solve their problem, and what products they would need to do that.
MoFu content is the most important type of content in the marketing funnel. According to Digital Marketer, a thoughtful MoFu campaign could get two or three times the return of ToFu content for online businesses.
To create MoFu content, you can use the same tactics that you’d use for ToFu content. But at the middle-of-funnel stage, you’d have to create content around the specific benefits, qualities, and address drawbacks of your product.
For example, let’s say you’re selling protein supplements for fitness products.
In this case, you could use Google’s search suggestions to uncover keywords that people search for for as they evaluate protein supplements.

The process is similar to the keyword research you’d do for ToFu content – but for MoFu content, the articles would be more focused around your product (i.e. protein supplements) than the value that you’re bringing (i.e. strength training).
The content you’d create at this stage could be how-to blog posts, video tutorials, case studies, success stories, or demo videos.
For example, Tactics, a skate shop, posts videos of shoe reviews. They source product reviews from customers, and post those reviews on YouTube for other potential customers to evaluate the products.

Same concept could be used for other industries as well. If you search ‘protein supplement reviews’, you’ll get a list of videos of product reviews from businesses:
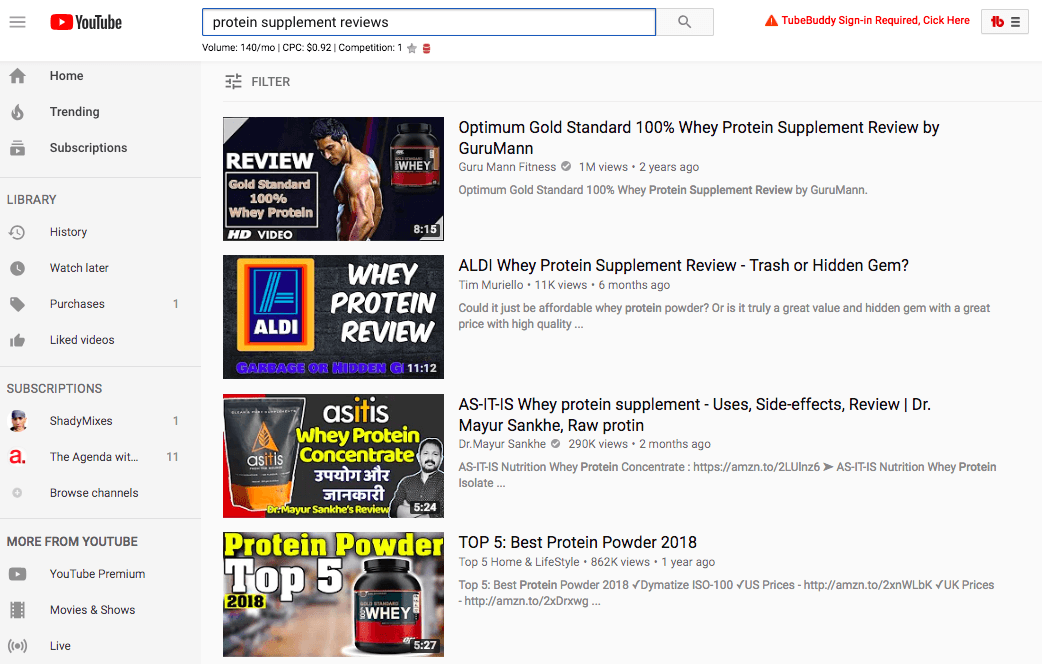
While many businesses share their middle-of-funnel content on the web in the form of videos and blog posts, you can also share that content with subscribers through an email autoresponder sequence.
Your autoresponder sequence can also be used to generate content ideas for your funnel. For example, check out the first email Wesley Parker sends in his autoresponder sequence:

In the email, he writes:
“I’ve got a very important question for you today, that is:
What is your biggest challenge when it comes to Adwords marketing?
The reason for me asking you this is because the number one aim of our newsletter is to help you generate more profit from paid search marketing and unless I know what you are struggling with, there is no way for me to write articles that help you solve your problems.
So if there is an area of paid search marketing that you are struggling with, please feel free to reply to this email and I will do my best to answer those questions.”
The main focus of the email was asking, “What’s your biggest challenge when it comes to Adwords marketing?”
You can create a similar first email around whatever problem you’re trying to solve – whether it’s related to fitness, fashion, marketing, or anything else. Based on the responses, you can create MoFu content specifically for your audience’s needs.
Ultimately, the goal of this type of content is to help customers move towards the process of making a decision in the final stage of the sales funnel.
We’ll cover the bottom-of-funnel stage in the coming chapters, along with upsells and customer retention.
2.4 A Step-by-Step Marketing Funnel Template
As you can tell, the marketing funnel stages follow the buyer’s journey pretty closely.
The top-of-funnel stage is the stage when customers become ‘aware’ of their problem and/or your business. At the middle of the funnel, they’re at the ‘consideration’ stage. At the bottom of the funnel, they get to the point where they’re ready to make a purchase.
The following marketing funnel template breaks down each of the stages, goals, and some additional tips on email marketing strategies you can use at each step:

At the top of the funnel, the goal is to create high-level, broad pieces of content that attract visitors – and if you can, generate email subscribers so you can push them down the funnel even faster.
From there, you can push subscribers into an email autoresponder sequence through the consideration stage and beyond.
In the coming chapters, we’ll discuss the later stages of the marketing funnel in more detail.
Chapter 2 Takeaways
- The marketing funnel stages are: 1) Top of Funnel, 2) Middle of Funnel, and 3) Bottom of Funnel. Your content should be optimized for each of the marketing funnel stages.
- Top-of-funnel content should create awareness about the problem your product or service sells. Middle-of-funnel content should help your potential customers evaluate the various products or services available to them. Bottom-of-funnel content should convince customers that your product or service is right for them.
- Use a marketing funnel template to plan and optimize your content.
Simply put, a well-crafted marketing funnel is essential to ensuring your business’s long-term success.
The Entrepreneur’s Guide to Funnel Hacking
In the previous chapters, we talked about building the right customer journey and crafting a marketing funnel to go along with it. In this chapter, we’re going to talk about funnel hacking, a quick way to build that marketing funnel by using other funnels have already been proven to work.
Funnel hacking is the process of digging into your competitors’ marketing funnels, and using versions of those funnels to sell your own products.
It’s one of the quickest, simplest ways to get your business started without having to build an entire marketing funnel from scratch. By using customer journey flows that your competitors have already built, you can get a head start in getting your online business off the ground. And then go back and tweak the funnel later once you’ve got your initial sales.
You can look at your competitors’ sales pages, landing pages, price points, emails, retargeting ads, and more to reverse engineer their sales process. Later in this chapter, we’ll talk more about Facebook advertising examples that you can funnel hack.
Here are a few things that’ll help you get started funnel hacking:
3.1 A Step-By-Step Guide to Funnel Hacking
Step 1: List out a few competitors to investigate
The first step is to make a list of competitors that sell products similar to yours. A good source for this is your Facebook news feed. Chances are that you fall into your competitors’ Facebook advertising demographic, too.
Your competitors could be both your direct competitors, and also indirect competitors who still occupy the market but might not be selling the exact type of products you’re looking to sell.
Step 2: Go through their funnel
As mentioned in the previous chapter, a funnel is simply a step-by-step process that businesses use to take customers from ‘awareness’ to ‘purchase.’
But you won’t be able to see your competitor’s entire funnel mapped out in the same way we mapped out the customer journey in Chapter 1.
That’s why you should go through as much of their funnel as you can, and screenshot everything.
Screenshot their website. Screenshot their opt-in copy. Screenshot their email funnel.
The goal is to get a clear picture of the marketing tactics your competitors are using to sell to customers, end-to-end. To do this, you can use the screenshotting tool on your computer, and save the screenshots into folders that are clearly labeled.

For example, in the screenshot above, I’ve created folders within ‘competitor funnel’ that will hold the ad copy, website opt-in copy, front end landing pages, and more. This way, you can get a clear picture of how your competitor is selling to their audience, step-by-step.
Funnels can get pretty complicated with various steps, but at a high level, the main types of content you’ll want to pay attention to are:
-
Front end landing pages. These are the landing pages that you’d come across when you first click on the ad.
-
Back end landing pages. These are the landing pages that are used for upsells, cross sells, downsells, etc. Usually they’re presented after the initial offer.
-
Ad copy and creative. Make a note of what kind of ad copy and creative they’re using to get customers from the news feed to the landing page in the first place.
- Email follow up series. Not all competitors will have an email follow up series on the back end, but if they do, be sure to capture what their autoresponder sequence looks like.
- Website opt-in copy. It’s not as important to focus on website copy, and many competitors will be running ads anyway, But also take a note of the copy they’re using to drive people to the call to action on their site (whether it’s to collect emails, drive them to a consultation call, etc).
Step 3: Make a note of sales triggers
The entire point of funnel hacking is to leverage same flow and messaging that your competitors are using to attract customers.
So as you’re going through their funnel, make a note of tactics you see them using.
Here are a few examples:
- Common messaging, phrases, or words used in the marketing copy
- How they frame headlines and subject lines
- What kind of social proof they have (i.e. videos, written, etc)
- Whether they present a webinar, eBook, video, or something else on their front end landing page.
- How many steps the funnel takes to complete
- Whether they have an email follow up sequence or not
- Product price points
- Landing page/sales page length
In the beginning, it will be difficult to see who’s doing it ‘right’ and who’s doing it ‘wrong’. Not all competitors you study will be using a strategy that you’d want to emulate.
But as you go through multiple different funnels in the same industry, you’ll be able to spot trends, and get a feel for what the ‘standards’ in the industry are when it comes to marketing content.
3.2 Funnel Hacking Tools
When it comes to building profitable funnels, you have to drive traffic to a page and convert that traffic.
The ‘customer journey’ is one way of building a process around converting that traffic, but the journey can be taken across just a handful of pages.
In this section, we’ll talk about how to uncover the tools your competitors are using to help them drive and convert more traffic.
Ghostery
One of the most effective Chrome extensions to do this is called Ghostery. Ghostery helps you uncover what kind of pixels and trackers are placed on web pages – for example, you’ll be able to see if a site has a Facebook pixel on it (i.e. whether or not they’re running Facebook ads).
The app is designed to let users stay ‘hidden’ from these trackers and pixels, but it’s also an effective way of seeing which trackers are being used on the site in the first place.
BuiltWith Technology Profiler
BuiltWith Technology Profiler is another Chrome extension that lets you see what technology the website you’re visiting is built with.
It’s a ‘site profiler’ tool that sends you information on all the technologies it finds on a given web page – including programming languages, advertising pixels, analytics, and more. You’ll see if a site is using Google Analytics, WordPress, AdSense for monetization, and more.
AdBeat
AtBeat is a more advanced tool that uncovers the strategies advertisers are using in your industry. You can see things like how many days they’ve been spending money on a campaign, the landing pages they’re using to collect emails and sell products, and more.
AdBeat lets you see what’s working for other successful companies in your niche, and will help you get a better sense of how you can apply their results to your own online business.
SEMrush
SEMrush is an SEO tool that marketers use to uncover insights about competitors. Through the tool, you can search how much organic traffic your competitors are getting, what they’re ranking for in search, and more.
SEMrush also estimates how much they’re spending on paid advertising, where they’re getting backlinks from, etc.
SimilarWeb
SimilarWeb is another advanced marketing insights tool that you can use to get a sense for what your competitors are doing. The tool allows you to see top referring sites, destination sites, and more.
3.3 How to Use Funnel Hacking to Growth Hack Your Business
When you go through your competitors’ funnels, a crucial step is actually the various products they have in their funnels.
While this might be expensive, it’s super important.
The reality is, competitors will have different sequences on the back end of their funnel, depending on what products you buy. By purchasing all their products, you can see exactly what’s going on behind closed doors. Take a note of their offers, upsells, downsells, cross sells, etc.
Ultimately, the product (or the ‘offer’) is the most important part of the marketing mix. And the sequencing of those products and the price points are what allow your competitors to run ads the way they do.
With the data you get from the tools above and insight into what happens on the back end of their funnel, you’ll be well equipped to replicate their funnel for your own product.
In this section, we’ll take you through the process of funnel hacking a campaign. We’ll also show you some examples of how companies growth hacked their business by running specific types of ads.
Hacking Front End Landing Pages
The ‘front end’ of a funnel refers to the initial offer that you’re presented with. Depending on the industry, some companies will present you with a ‘low ticket’ item first (i.e. a relatively cheap product) before presenting you with more expensive products on the back end.
To hack the front end of a funnel, you’ll want to screenshot and take note of the initial landing page you’re directed to when clicking on a customer’s ad,
Be sure to capture examples related to how they write copy in the ads, how they write sales letters, custom graphics/images, and any tracking codes.
Once you have your list of competitors, you can navigate over to their Facebook page, click ‘Info and Ads’ on the left hand bar, and scroll through the ads they’re currently running. For example, if you’re starting an e-commerce business, you can learn from funnel hacking a product like Organifi:

You can click through on the ads as well to see what landing page they direct to:

Another example of a successful funnel is MentorBox (run by Alex Mehr), an online video series that features interviews with bestselling authors and other experts. If you’re selling a video series, course, or subscription product, this would be a good funnel to dig into:

Take note of the headlines, videos, and CTAs on their landing page:

Funnel Hacking Front-End Offers
The offer is the most important part of any marketing funnel.
Once you get a feel for the front end landing page, start looking at what they’re actually offering. Is it s subscription product? Is it an expensive physical product? Is it a cheap product? What kind of price point are they hitting?
For example, MentorBox initially presents visitors with a $7-per-month subscription, but positions it as a ‘Free for 3 days’ trial:

These subtleties are important because they show you the ‘angles’ you can use to sell your own products.
Funnel hacking the back end
This is the most crucial, but also the most difficult part of the funnel hacking process.
The back end of any funnel is where the majority of profits are generated. It’s also where businesses ‘ascend’ their customers to higher level, higher ticket offers.
But the back end is also more complicated than the front end, and it’s more difficult to analyze what’s going on.
For example, if you join the initial $7 per month subscription for mentorbox, you’ll get this offer to join Entrepreneur’s Academy:
If you decline the offer (by scrolling down to the bottom of the page and click ‘no thank you’), you’ll get presented with another offer to join a $99 product:

If you decline this offer, you’ll get the option to purchase a monthly physical box membership from MentorBox:

And so on.
There are usually two main ‘purchase flows’ in a funnel – one set for people who buy each upsell, and one for people who decline to buy.
Going through the entire process will help you get a sense for the products and your competitors are selling to maximize lifetime value.
Funnel hacking retargeting ads
Many times, marketers will target you with ads once you visit their website.
If you see these ads in your news feed, make a note of them. Screenshot them, and screenshot the landing page that you get directed to after clicking on it.
And most importantly, take note of when you see the retargeting ad. Was it after you joined their email list? After you visited a certain page on their website?
Retargeting ads typically are used to get visitors to complete an action that they initiated but didn’t finish. This might mean completing a checkout order, buying a product from a sales page, etc.
Funnel hacking email sequences
One way to uncover which competitor really knows what they’re doing is by seeing which ones send you follow-up emails after you sign up.
Smart marketers always have an email follow-up system in place to take you on the ‘journey’ of buying more products from them down the road. Keep a note of the emails that you receive, and the products that they push through email.
You’ll be able to put together your own email sequence based on the emails you receive from your competitors.
Chapter 3 Takeaways
- Funnel hacking is the process of digging into your competitors’ marketing funnels and using versions of those funnels to sell your own products.
- First, list out some competitors to investigate, go through their funnel, and make a note of the ‘sales triggers’ they use. Take a look at some Facebook advertising examples and retargeting ads, and consider applying their strategies to your business.
- You can use certain software tools and Chrome extensions to get insight into what competitors are doing.
Through funnel hacking, you can get a head start in getting your online business off the ground. Plus, you can go back and tweak the funnel once you’ve figured out what works.
How to Build a High-Converting Sales Funnel
A solid sales funnel is the most crucial aspect of building an online business. Without a sales funnel, you won’t have any consistent way of bringing in sales over the long term.
You could be following all the best practices and have the best product. You could have the most informative blog in your space. You could have a high-converting opt-in form.
But if you can’t drive prospects to a sale, none of that matters.
If you’ve read Chapter 1, 2, and 3, you’ve got a very good foundation on crafting the buyer’s journey, and building marketing funnels around that journey.
This chapter is about the last piece of the puzzle: converting customers to purchase.
In this chapter, we’ll look at sales funnel examples, sales funnel analytics, and conversion funnels.
Very few businesses do this last part correctly But the ones who do end up reaping massive rewards.
Here’s a traditional sales funnel example:
 The terms “marketing funnel” and “sales funnel” are used interchangeably in many cases. In this case, we’ll use the term “sales funnel” to refer to parts of the process that lies closest to the conversion. Customers start off at the ‘awareness’ stage, where they first become aware of their problem or your business.
From there, they become interested to learn more – either by opting in to your email list, subscribing to a newsletter, etc.
After the interest phase is the consideration phase, where customers look for more specific information about your product or service. From there, they start to evaluate your product against the competition before purchasing.
We expand on this more in Chapter 1 and Chapter 2 where we talk about the buyer’s journey, and crafting a marketing funnel to go along with that. We talked about creating the right type of content for the top-of-funnel stage, and moving customers down a path to purchase.
In this chapter, we’ll be talking about a nontraditional ‘sales funnel’ model.
Most businesses only focus on the steps above when building their funnel. The traditional sales funnel model is based on the AIDA approach (attention, interest, decision, action).
While this formula is a great first step, there are more steps to take to build a funnel that’s truly comprehensive, and takes care of customers throughout the purchase process (and even after the purchase stage).
We’ll talk about how to build a modern-day sales funnel for your online business using a conversion funnel.
A conversion funnel places more emphasis on customer behaviors, retention, and lead nurturing at every step of the process. It also focuses on the customer journey after purchase – which helps in maximizing lifetime value from your customers.
Here’s a chart on what a conversion funnel could look like for your business:

While the terms are different, the ‘top of funnel’ (i.e. the ‘acquire’ and ‘activate’ stages) are similar to the ‘awareness’, ‘interest’, and ‘consideration’ stages of a traditional marketing funnel.
In this chapter, we’ll expand more on the ‘bottom-of-funnel’ stages, around things like keeping customers, up-selling, cross-selling, and getting referrals.
4.1 Stages of a Conversion Funnel
Stage 1: Acquiring customers
The first step of any successful sales funnel is having a process in place that attracts customers from channels like social media, blogs, etc.
The goal here is to attract quality prospects that have a good shot at converting to paying customers.
If you’re just getting started in online business, you can ‘funnel hack’ this process by looking at what your competitors are doing. Look at what they’re doing with their blog, or how they’re running ads on Facebook. Look at their landing pages, and how they’re qualifying their prospects.
For example, check out Impact Branding and Design, a company that helps businesses get more leads from their blogs:

Notice how the page ‘qualifies’ leads by asking them their first name, last name, email, company name, and website. This increases the likelihood that people who sign up would be the kind of people that Impact Branding and Design would want to convert to customers.
When looking landing page forms, websites, and ads of your competitors, make sure to make a note of how they’re crafting their messaging.
The reality is, good copy is a lot more important than people think. Ultimately, the messaging around a product is what gets customers to opt-in and eventually purchase.
It’s what a lot of marketers miss.
For example, saying that you run the ‘number 1 marketing agency’, or an ‘award-winning company’ won’t do much to persuade customers to take the next step in the journey. But if you said something like, “we’ll help you generate more leads from your blog”, that’s a specific, enticing, meaningful offer that could get signups.
Organifi is another great example. They sell juices and supplements. Check out the copy on one of their product pages:

Notice how they write their headline: “Live a healthier life in just one minute a day.” They hit on the key value point that their customers are looking for (living a healthier life), and they’re promising to help their customers do it in less time (one minute a day).
Copy like this is very enticing, and can help rapidly increase your signups both at the top of funnel, and every corresponding step.
Stage 2: Incentivizing action
Once a customer lands on your landing page from your ad or blog post, it’s important that you create an emotional response within them to continue down the rest of the process.
One way to do this is by making sure that your landing page is ‘congruent’ with the ad that you placed before it.
If the content on an ad looks and feels different from the content on the following landing page, customers will get confused.
Let’s take Organifi again as an example. Here’s an ad that they’re running on Facebook:

Notice how the ad starts off talking about pain points of the people they’re targeting – Organifi is hitting people who are older with lower metabolism, so the copy reflects that.
The headline reads, “How Can Organifi Help You?”
When you click on the ad, you’d expect to land on a page offering more information about Organifi products. And that’s exactly what you see:

Once you click the ‘learn more’ button on the ad, you land on the page above where you learn more about the various types of juices Organifi has to offer.
At this stage, you might also want to leverage email marketing to drive your prospects to take action – especially if you’ve already collected their email address in the acquisition stage.
Email marketing can have unbelievably high returns for a business – in fact, it brings higher ROI than any other marketing channel available.
Check out Seamless, a food delivery company that sends emails to their busy customers to incentivize more of them to buy:

Stage 3: Craft your conversion funnel content strategy to maximize lifetime value
It’s important to have a strategy for delivering content that resonates with your customers at every step of the funnel.
It’s not just about delivering ads or capturing emails. It’s about incorporating messaging that pushes your prospects down the funnel in the most effective way possible.
Let’s say you have a small sales software tool that helps businesses make their sales team more efficient.
To acquire more leads, you might consider writing blog posts about how to hit your sales quota, sales call scripts, and so on. To incentivize action, you might offer a free e-book or a video in exchange a prospect’s email address at the end of your blog posts.
Activating customers would likely happen after a company realizes they’re having trouble hitting their sales numbers consistently.
But most businesses stop at this stage. They craft a conversion funnel to acquire and activate customers, but they don’t have an effective process in place for retaining and nurturing their customers.
The reality is, it costs FAR less to retain an existing customer than sell to a new one. And having a process in place to retain, nurture, and upsell your customers will help you grow revenues in a much smoother way.
There are different ways you can do this. For example, if you run a sales software company, retaining customers could be as simple as proving to them that you can solve their problems.
Loyalty programs can also help encourage repeat business. Data shows that 81% of customers say loyalty programs make them more likely to continue doing business with the brand.
Loyalty programs don’t have to be complicated, especially when you’re first starting out. Just make sure to hit a few key components:
- Reward specific actions that customers take. The main goal of loyalty programs is to get customers to buy again. But that also means you can reward your customers for taking certain types of actions, like registrations, referrals, social shares, and more.
- How will customers redeem and use their rewards? Once customers have earned a reward, you’ve got to figure out how they will be able to access it and use it for a future purchase. For example, you might offer something simple like a custom made promo code,
- What kind of rewards will be offered? If you’re offering a simple promo code, think about what products you’ll be offering within that promo. Think about the percentage discount you’ll be able to give your customers on your existing products. The reality is, the amount of rewards you offer isn’t nearly as important as the ease-of-use of your loyalty program.
4.2 Sales Funnel Examples
In this section, we’ll give some more examples of how to go about getting awareness around your business to acquire customers, and how to activate them.
We’ll talk about how to create ‘bottom of the funnel’ systems to convert more customers.
The ‘Free Book’ + Shipping funnel
There’s a certain level of authority you get when you have a book published.
Even if the book isn’t a bestseller, it still creates a certain amount of perceived authority.
One great way to capture email addresses to send them emails in the future with promo details is by building a ‘free book’ funnel. This is an example of a sales funnel that can be really effective.
For example, the landing page might look something like this:

This would be an example of a page that could help both acquire leads and activate customers.
You could place the title of the book at the top, a quick video or an intro paragraph discussing the book, and a form to guide people through paying for shipping for the book.
The free book offer can generate a ton of leads quickly, while covering costs.
From here, you could add additional landing pages after this to sell higher ticket offers and generate profit.
The giveaway funnel
One effective sales funnel example is the giveaway. Hosting a giveaway is a great way to capture top-of-funnel leads to sell them something down the road. Giveaways can generate a massive amount of leads.
But there’s a risk that comes with it, too.
People love free stuff. They love free clothes, watches, headphones, and software. So the problem is, you might get a lot of low-quality leads.
One way to mitigate this is by selecting a specific, niche prize. Instead of choosing a generic prize like an iPad or cash, choose something that your potential customers would be interested in.

The sales call funnel
If you’re running a services business or an online business selling high-ticket products, the ‘sales call funnel’ can add massive value to our business.
It’s also effective for e-commerce companies where customers typically make a phone call before purchasing.
This sales funnel is designed to get prospects on a sales call as fast as possible.
Here’s what the initial landing page could look like:

The funnel follows a few key steps:
First of all, it’s important to present a valuable offer.
In the example above, the video shares client generation tactics in exchange for a prospect’s email address.
The second step is to deliver that ‘lead magnet’ in whatever format you choose. While the format doesn’t matter, it does matter that the video fills the promise you’re claiming to fill.
After that, you can further qualify leads through an application. To make sure that your time on the sales call won’t be wasted, make your leads fill a simple form before booking a call with you – so you only get the most qualified people on the phone.
Finally, once leads sign up and go through your sign up process, give them the opportunity to book a call with you over the phone.
Each ‘step’ is typically presented in one page after another.
Chapter 4 Takeaways
- A conversion funnel places more emphasis on customer behaviors, retention, and lead nurturing at every step of the process.
- The stages of the conversion funnel include acquisition, incentivizing action, and crafting a content strategy to maximize lifetime value once customers are activated.
There are a lot of different types of funnels out there that you can build, such as giveaway funnels, sales call funnels, free book funnels, and more. Choose one based on your strategy to get started.
A Step-by-Step Guide to Conversion Rate Optimization (CRO)
In the previous chapters, we talked about how to craft your buyer’s journey, how to build a sales and marketing funnel around it, and ‘funnel hacking’ your way to a profitable funnel that can bring in profits for your online business consistently. In this chapter, we’ll talk about another important piece of the puzzle: conversion rate optimization, also known as CRO.
Firstly, what is conversion? The term essentially refers to a visitor on your site taking the action that you want them to take – like signing up for your email list or buying your product.
For example, if you’re selling services, you might be trying to get more people to sign up for a consultation call. If you’re selling e-commerce products, you might be trying to get more visitors to add products to their cart, or checkout once they’ve added those products. If you’re selling software, you might want to get visitors to book a demo with a sales rep.
Whatever you’re trying to get your visitors to do, you’ll want to systematically decide how to get them to take that action – whether it’s through your website design, your copy, or a combination.
The reality is, paid advertising is only getting more expensive, and if there are issues in your funnel, then you’re leaving money on the table. Conversion rate optimization helps you identify those problems in your funnel first, so you can bring in more revenue for every dollar spent on advertising.
Conversion rate optimization also helps you maximize profits, as your profits are innately tied to your conversion rate.
In this chapter, we’ll talk about conversion rate optimization tips, examples, and strategies. We’ll also give you an example of a conversion rate optimization audit checklist.
Depending on how deep you go, conversion rate optimization can be an advanced subject given how much it involves data and statistics.
5.1 Essential Conversion Rate Optimization Terms You Need to Know
Before we discuss conversion rate optimization in detail, let’s go over some essential definitions for this section.
A/B testing (or split testing)
A/B testing refers to testing one version of a page against another version the same page with one slight change. The effectiveness of the pages is then measured against each other.
For example, if the objective is to increase clicks to the pricing page from the home page, you might test two different home page layouts that look identical apart from the ‘pricing page’ link copy.
When you do A/B testing, you only test one element at a time.
Multivariate testing (MVT)
Multivariate testing is a more advanced form of testing that refers to creating multiple variations if different page elements in different combinations to gauge which combination performs the best.
In a multivariate test, you might test different variations of pictures, copy, colors, and/or layouts to see which combination is most effective at driving the action that you’re looking to drive.
Bounce rate
Your bounce rate refers to the percentage of people who leave your website after viewing a single page. If you have a high bounce rate, it means that your visitors aren’t finding what they’re looking for.
Average time on site
The time on site metric shows you exactly how long visitors are staying on your page before leaving. If you have a low time on site, you probably also have a high bounce rate – this means that visitors aren’t finding what they’re looking for on your site.
Primary conversion
The primary conversion goal refers to the most ideal action that a visitor can take on your site.
For example, for an e-commerce site, your primary conversion objective would be the ‘Add to Cart’ button.
For a subscription site, it would be the ‘Sign up now’ button.
Secondary conversion
The secondary conversion goal refers to the next best action a visitor can take if they’re not yet ready to click on the primary call to action.
For example, for an e-commerce site, it might be viewing product details. For a software company, it might be clicking through to the pricing page. For a subscription site, it might be requesting more information.
Customer acquisition cost (CAC)
Your customer acquisition cost is the cost you pay to acquire a new customer. One of the benefits of conversion rate optimization is that can immediately cut your CAC by a significant margin. For example, if your conversion rate doubles, your CAC will get cut in half. You can take that money and spend on additional acquisition, if you see fit.
5.2 How to Conduct a Conversion Rate Optimization Audit
The core of conversion rate optimization is about finding out why visitors don’t become customers, and fixing those problems. That’s why before you can tweak your website or your funnel to improve conversions, you need to conduct a full audit of your site and current traffic sources.
Here’s a full conversion rate optimization audit checklist:
Step 1: Evaluate your business goals
Before you start your audit, it’s important to have a real idea of what you want to get it out of it.
For example, let’s say you have an e-commerce store that sells nutrition supplements, like Organifi. For most e-commerce stores, sending promotional emails to an email list is a great way of generating sales. Let’s say that’s a key component of driving revenues for your business.
In a situation like that, your secondary conversion goal might be to get users to subscribe to your email list in exchange for some kind of opt-in incentive.
Based on that information, you can then get a better understanding of where to start when it comes to evaluating your site – for example, if you want to get more email subscribers, you might analyze your current pop-up boxes, opt-in forms, and other opt-in incentives to find out exactly how you can get the most signups.
If you don’t have Google Analytics installed on your site already, this would also be a good time to do that. We’ll talk more in-depth about measuring analytics in the next chapter, but Google Analytics can provide a good foundation for analyzing your site. For example, you can get a sense for certain pages or screens that users visit, how many pages are in one session, how long they spend on the site, and more.
You can also tie each ‘action’ on the site to a dollar value. For example, let’s say you know that out of every 1000 visits, you get 10 opt-ins, and out of 10 opt-ins you get 3 customers. If each customer has a lifetime value of $70, then you can say that each ‘view’ is worth $0.21 to your business.
Step 2: Evaluate your UX
UX stands for user experience.
The user experience of your site involves the entire experience that a customer has when they visit your site, from beginning to end.
UX is about more than just visual design or how a website looks. It’s about how intuitive it feels, how easy it is to navigate, how fast the pages load, and more. A site might look amazing, but if the pages take a long time to load, then that’s bad UX.
There ‘user experience honeycomb‘ can be used to describe some of the most important aspects of UX design.

Usefulness: How useful is your site? Does it help your visitors achieve their goals, or is there a high bounce rate because visitors aren’t finding what they’re looking for?
Usable: How is your navigation? Does it feel natural? Does the process of completing your primary conversion goal feel intuitive? If not, you’re going to have issues with your conversion rate.
Desirable: Sure, visual design is only a small part of UX design as a whole, but you need to make sure that your site feels desirable to use. Don’t send users to a dull website that feels outdated.
Findable: Can users find what they need to find on your site? Do they have to think about what to do, or are they able to naturally do it?
Accessible: Just as buildings have elevators and ramps, your website should be accessible to people with disabilities.
Credible: Does your website appear credible? Part of this involves visual design, but it also involves things like security, reviews, testimonials, and more.
Step 3: Evaluate your analytics
If your website analytics aren’t accurate, then your conversion rate optimization audit won’t be accurate either.
It’s very important to to make sure that your analytics are set up properly without errors.
If you spend time double checking your analytics set up, you’ll save a lot of time down the road. You won’t have to worry about making mistakes and making decisions based on corrupted data.
Here are a few key things to keep in mind as you’re setting up Google Analytics on your site:
- Are you collecting enough data?
- Are you collecting credible data?
- Are there are technical errors that you need to fix?
When it comes to technical errors, here are some common mistakes people make:
Filter settings:
In many cases, you might just be looking at the wrong data in Google analytics because of applying incorrect filter settings.
This can happen if you include multiple ‘include’ filters.
Multiple tracking codes:
If you have multiple tracking codes of Google Analytics on your web pages, it might throw off your data (especially if you’re using Classic Analytics).
Wrong tracking snippets:
Another big mistake that people make is using the wrong tracking codes on a website to track data. This can be the case especially if you’re managing multiple websites.
Incorrect account view:
If you have access to the analytics of multiple websites, you might be using the incorrect account view, or an incorrect tracking snippet from a different account than the one you’re looking to assess.
Another set of common issues have to do with the tag manager:
Unpublished container
Double check to make sure the container is published after you add the Analytics tag. You can make changes to a container, but it won’t actually take effect until it’s published. We’ll talk more about this in the next chapter.
Wrong trigger configuration
Sometimes a trigger that you set up won’t fire as expected. It’s important to double check the conditions you’re targeting and the trigger behaviors that you have set.
By making sure that your analytics set up is done properly, you can save a lot of time by collecting accurate data from the very beginning.
Step 4: Collect qualitative data
Conversion rate optimization isn’t just about statistics and analytics.
Collecting qualitative data can be just as useful, if not more useful, when adjusting the UX of a website.
One way to do this is by conducting usability tests.
Usability tests are an effective way to see, in real time, what challenges or issues users have when completing primary or secondary goals on your website.
For example, you could get a group of ‘test users’, give them a set of tasks, and watch how they complete them on your site. If the demographics of your test users are similar to the demographics of your actual visitors, you’ll get a pretty good gauge of how your actual visitors are interacting with your site. You can watch them as they figure out how to complete the goals you set for them, and get feedback from them afterwards.
Even if you think your site is very user friendly, you’ll likely find areas that are hard to navigate
Chances are you’ll find that certain areas of your site are hard to navigate or have unnecessary friction.
A quick way to conduct usability tests at once is by using a site like UserTesting.
UserTesting has a wide range of testers from different demographics. To make sure that you’re getting the right people looking at your site, you can create filters and screener questions. For example, you can have people answer what industry they work in before they go through your website.

You can also set your demographic filters by criteria like age, gender, country, and even what device they should use.

5.3 Conversion Rate Optimization Examples (And Case Studies)
In this section, we’ll break down some examples of companies that have conducted tests to boost the conversion rate on their site.
We’ll show the test they ran, the results, and more.
How Kuna boosted sales by 89%
Kuna is a business that sells home security products.
Initially they had approached an marketing agency with plans for a full website redesign. They thought that revamping the website was what they needed to do in order to grow sales.
Before executing on a strategy,the agency decided to run a series of mall experiments to decide how they should approach the redesign. They wanted to see whether or not a complete overhaul was needed, or whether small tweaks could do the trick.
The ultimate goal was to focus the conversion improvement efforts on home page bounce rates, purchase conversions, and total sales.
Here’s how they did it:
First, they started by collecting qualitative data. In this particular case, they conducted a simple survey. They spent time understanding what motivated their customers to purchase, They spent time understanding the way customers perceived their products and talked about them.

Based on that qualitative data, they performed some updates according to the data. They changed the cover photo, the copy, and the overall feel of the home page of the site. They updated the home page with a red ‘buy now’ button as well, and moved a demo video above the fold.
The copy was changed to reflect how customers actually spoke about the product and their motivations around buying (i.e. “prevent break-ins before they happen” as opposed to “know who’s coming”).
These changes grew sales by 89% in just three weeks.
This proved that the change in content above the fold helped communicate the product’s value in a more effective way.

Kuna performed more tests in which they focused more on addressing the needs of their customers, revamping the checkout process, and in general, improving the site’s credibility.
Over the next several months, they ended up growing revenues by 265%.
The biggest takeaways from this conversion rate optimization example is to make sure that the language you’re using reflects the language that your customers use. We touched on this in the funnel hacking chapter, and it’s an important component to growing conversions.
It’s also important to create a certain level of visual intrigue on the homepage as well, to help communicate your product’s story faster and more effectively. And of course, improving navigation to make the shopping and checkout experience as seamless as possible will also help improve your conversions.
How Morphsuits boosted their conversion rate by 37%
Morphsuits is an online retailer that sells full-body spandex costumes.
Based on their analysis in Google Analytics, they found a checkout page that was underperforming in terms of conversions. They ran some deeper tests to get a more accurate gauge of what exactly about the page was causing it to underperform.
They went through a deep optimization process, ran some A/B tests and usability tests, and figured out exactly what their problem was.
After they got a sense for what was at the root of the problem on the checkout page, they started testing out potential improvements.
What they discovered was something expected.
They found that a major issue in the checkout flow was at the ‘order review’ stage. This is the stage after visitors had added items to the cart, but haven’t purchased. At this stage, customers are seeing that everything in the cart matches up with what they put into it.
Initially, they had a very basic order review page – a black and white page with no pictures and poor visual design. While it displayed all the necessary information, it just wasn’t appealing to look at.
Check out version B below, this is the new order review page that Morphsuits came up with:

With the new design, they were able to boost conversions by 37%, just with simple improvements in visual design.
You can take away a couple of things from this experiment:
-
By breaking down your analytics, you can find specific pages that have issues when it comes to users checking out (or completing the primary goal on your site).
- It’s incredible how relatively simple style changes or color changes can have a massive impact on your bottom line.
Chapter 5 takeaways
- Essential terms to understand when talking about conversion rate optimization is A/B testing, Multivariate testing, bounce rate, average time on site, primary conversion, secondary conversion, customer acquisition cost, and so on.
- When it comes to conversion rate optimization, be sure to understand the language your market is using to solve their problems.
- Take a look at the above conversion rate optimization examples for strategies and tips.
The main steps to conducting a conversion rate optimization audit are evaluating your business goals, evaluating your UX, evaluating your analytics, and collecting qualitative data.
How to use Google Analytics with Funnels
In this chapter, we’ll talk about how to set up Google Analytics, conversion tracking, and measuring analytics on your business website.
Measuring analytics is an important component of building your online business. If you’ve got solid data in place to assess how you’re doing, you’ll be able to make appropriate adjustments to your sales and marketing funnels.
Measuring analytics will give you information on things like:
- The number of visitors on your site
- How visitors you get on a daily (or monthly) basis
- Where your visitors are coming from
- The percentage of recurring visitors on your site compared to new visitors
- The pages on your site with the most (and least) number of views
- How many leads your pages are generating
And much more.
There’s a lot Google Analytics can do for you, and much of it depends on how you configure it.
In the following section, we’ll talk a little bit about how to configure Google Analytics and get the most out of it.
6.1 How to Set up Google Analytics
Before you can install Google Analytics, you’ll need to get a Google Analytics account.
If you have a primary Google Account that you use for services like Gmail, Google Drive, Google Calendar, or other Google services, then you can set up Google Analytics using that same account.
If you don’t have a Gmail account, you’ll have to create one.
In any case, it’s always a good idea to make sure that you create your Google Analytics account under an email address that you own – not a developer, team member, or anyone else.
Here are some basic steps on how to install Google Analytics for the first time.
Step 1: Set up your Google Analytics account
If you’ve got a Gmail set up already, you can go to navigate over to the Google Analytics page, and click the ‘sign in’ link.
You’ll be prompted to go through a three-step process to start analyzing your site’s traffic by 1) signing up for Google Analytics, 2) adding a tracking code, and 3) learning about your audience.

The first step is to hit the ‘sign up’ link under ‘Start using Google Analytics’ on the right. Once you hit that link, you’ll see the screen below:

If you have a Gmail account, Google Analytics will allow you to have 100 different Google Analytics accounts within that one Gmail account. You can also include 50 different ‘properties’ in your Google Analytics account. And within each property, you’ll get up to 25 views.
You can set up your Google Analytics account in whatever way you see fit – it just depends on how you want to organize your sites.
Since this is just a basic guide, we’ll give you instructions on how to set up a Google Analytics account for one site, one view, etc.The setup would look something like this.

Beneath this, you will have the option to configure where your Google Analytics data can be shared.

Step 2: Install your tracking code
Once you are finished, you will click the Get Tracking ID button. You will get a popup of the Google Analytics terms and conditions, which you have to agree to. Then you will get your Google Analytics code.

If you have a Shopify e-commerce store, you will go to your Online Store settings and paste in your tracking code where specified.
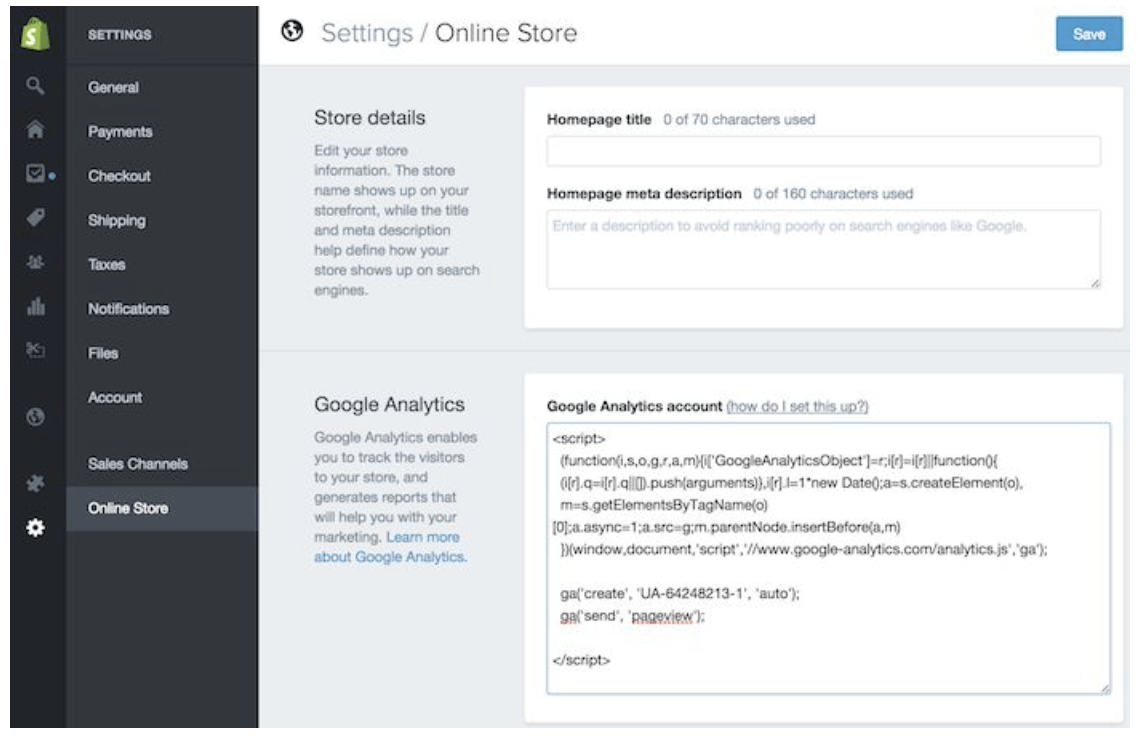
The process of installing Google Analytics depends on the platform you use – for example, the process would be different depending on the content management system you use, the website builder you use, whether you use some sort of e-commerce software, etc. But no matter what systems you’re using, you should be able to find instructions on installing and measuring analytics for the platform.
Step 3: Set up goals
After you install your tracking code on your website, you will want to configure a small (but very useful) setting in your website’s profile on Google Analytics. This is your Goals setting. You can find it by clicking on the Admin link at the top of your Google Analytics and then clicking on Goals under your website’s View column.

Goals will tell Google Analytics when something important has happened on your website. For example, if you have a website where you generate leads through a contact form, you will want to find (or create) a thank you page that visitors end upon once they have submitted their contact information. Or, if you have a website where you sell products, you will want to find (or create) a final thank you or confirmation page for visitors to land upon once they have completed a purchase.
That URL will likely look something like this.
- https://123business.com/thank-you
- https://123business.com/thank-you/
- https://123business.com/thank-you.html
In Google Analytics, you will click on the New Goal button.

You will choose the Custom option (unless one of the other options are more applicable to your website) and click the Next Step button.

You will name your goal something you will remember, select Destination, and then click the Next Step button.

You will enter your thank-you or confirmation page’s URL after the .com of your website in the Destination field and change the drop-down to ‘Begins with’.

You will then toggle the value and enter a specific dollar value for that conversion (if applicable) and click Create Goal to complete the setup.
If you have other similar goals or conversions you would like to track on your website, you can follow these steps again. You can create up to 20 goals on your website. Be sure that the ones you create are highly important to your business. These goals (for most businesses) include lead form submissions, email list sign-ups, and purchase completions. Depending on your website and its purpose, your goals may vary.
Note that this is the simplest of all conversion tracking in Google Analytics. You can review the documentation in Google Analytics support to learn more about setting up goal tracking.
Step 4: View Google Analytics data
Once you start getting in Google Analytics data, you can start learning about your website traffic. Each time you log in to Google Analytics, you will be taken to your Audience Overview report. Alternatively, if you have more than one website, you will be taken to your list of websites to choose from, and then taken to the Audience Overview report for that website. This is the first of over 50 reports that are available to you in Google Analytics. You can also access these reports by clicking on the Reporting link at the top.

Step 5: Standard report features
Most of the standard reports within Google Analytics will look similar to this. At the top right, you can click on the drop-down arrow next to your website to switch to different websites within all of your Google Analytics accounts. Or you can click the Home link at the top.

In the report at the top right, you can click on the dates to change the date range of the data you are viewing. You can also check the Compare box to compare your data from one date range (such as this month) to a previous date range (such as last month) to view your data.
You can hover over a variety of areas on your Google Analytics reports to get more information. For example, in the Audience Overview, hovering over the line on the graph will give you the number of sessions for a particular day. Hovering over the metrics beneath the graph will tell you what each one means.
Beneath the main metrics, you will see reports that you can switch through to see the top ten languages, countries, cities, browsers, operating systems, services providers, and screen resolutions of your visitors.
You can click the full report link on each to see the full reports. Or you can click on any of the top ten links to see more details. For example, clicking on the United States in Countries will take you to the full Location report, focused in on visitors from states within the US.
In this view, you can hover over each state to see the number of visitors from that state. You can scroll down to the table and hover over each column name to learn more about each metric.
You can also click on the name of each state to see visitors from cities within the state. Effectively, any time you see a clickable link or a small question mark next to something, you can click on it or hover over it to learn more. The more time you spend measuring analytics, the more interesting information you will find.
6.2 Measuring Analytics on Your Campaigns
Speaking of reports, here is quick summary of what you will find in each of the standard Google Analytics reporting sections, accessible in the left sidebar.
Everything in (parenthesis) is a specific report or set of reports within the following sections that you can refer to.
Audience reports
These reports tell you everything you want to know about your visitors. In them, you will find detailed reports for your visitors’ age and gender (Demographics), what their general interests are (Interests), where they come from (Geo > Location) and what language they speak (Geo > Language), how often they visit your website (Behavior), and the technology they use to view your website (Technology and Mobile).
Acquisition reports
These reports will tell you everything you want to know about what drove visitors to your website (All Traffic). You will see your traffic broken down by main categories (All Traffic > Channels) and specific sources (All Traffic > Source/Medium).
You can learn everything about traffic from social networks (Social). You can also connect Google Analytics to AdWords to learn more about PPC campaigns and to Google Webmaster Tools/Search Console to learn more about search traffic (Search Engine Optimization)
Behavior reports
These reports will tell you everything you want to know about your content. Particularly, the top pages on your website (Site Content > All Pages), the top entry pages on your website (Site Content > Landing Pages), and the top exit pages on your website (Site Content > Exit Pages).
If you set up Site Search, you will be able to see what terms are searched for (Site Search > Search Terms) and the pages they are searched upon (Site Search > Pages).
You can also learn how fast your website loads (Site Speed) as well as find specific suggestions from Google on how to make your website faster (Site Speed > Speed Suggestions).
Conversions
If you set up Goals within your Google Analytics, you can see how many conversions your website has received (Goals > Overview) and what URLs they happened upon (Goals > Goal URLs). You can also see the path that visitors took to complete the conversion (Goals > Reverse Goal Path).
Speaking of goals and conversions, most of the tables within Google Analytics standard reports will tie specific data to your conversions. For example, you can see the number of conversions made by visitors from California in the Audience > Geo > Location report. You can see the number of conversions made by visitors from Facebook in the Acquisitions > All Traffic > Source/Medium report. You can see the number of conversions made by visitors who landed on specific pages in the Behavior > Site Content > Landing Pages report.
6.3 Other tools for measuring analytics
While Google Analytics is a great tool for measuring analytics, there are other useful tools
1. Buffer
Buffer performs analytics on social media posts and shares. You can see what your most popular tweet or post was over time. Buffer’s free plan gives you access to information on Facebook, Twitter, Google Plus, and LinkedIn, widening the scope for your social media outreach. You can pay for more extended metrics if desired.
The Buffer-provided statistics are valuable to determine if you’re hitting your social media goals and to identify where you can improve your outreach. You can easily tell whether you are getting the most from your social networking or if you need to do more to increase your audience. It also enables you to compare your average social media post’s performance to the average current post performance to see how well it did.
2. Followerwonk
Followerwonk analyzes a Twitter account’s followers and tweets to present a range of information useful for targeted marketing. The data is broken into charts that make for a simplified graphical representation. Followerwonk also allows you to figure out most-used hashtags for an account as well as optimal times for tweeting (when most of the followers are active on Twitter).
As a tool, Followerwonk is a statistics-based treasure trove. The insight provided by Followerwonk allows you to streamline posting times and use Twitter more effectively as a marketing channel. You can even research your competitors since Followerwonk is not limited to providing data for a single Twitter account.
3. Cyfe
Cyfe has been featured in a number of magazines as a useful tool to help businesses amalgamate their metrics in one handy dashboard. It can monitor multiple websites on multiple different platforms, allowing you to draw conclusions across the board. Through the app’s separation of dashboards into intuitive groups, you can focus on one specific element of your marketing plan, such as social media or finance.
For most businesses, the free options, which limit the number of dashboards you can view, should suffice. Even the premium option ($168/year) is reasonably priced given what Cyfe offers.
Chapter 6 takeaways
- Make sure to avoid the common mistakes and errors that people make around setting up Google Analytics on their site.
- Measuring analytics can help you determine the success of your campaigns. Take a look at at audience reports, acquisition reports, behavior reports, conversions, and more.
- Apart from Google Analytics, you can use tools like Buffer, Followerwonk, and Cyfe for measuring analytics and collecting useful data.
When you’re setting up a marketing funnel or a sales funnel, Google Analytics is an indispensable tool.